March 15, 2022

About the Cities Index
The NAE Cities Index is the first-ever comprehensive, interactive look at how the nation’s largest 100 cities welcome immigrants. It aims to help answer two of the questions at the heart of the immigration debate: How well are immigrants integrating into the fabric of American life, and what role do cities play in that process? The NAE Cities Index provides the first opportunity to assess these questions and understand how immigrants and their destination communities are faring. We invite you to explore the evolution of the Index and the research that forms its foundation.
Background Advisory Committee Best Practices MethodologyBackground
 Immigration is vital to the long-term prosperity of American cities and the U.S. economy. It creates business opportunities, spurs job growth, and revitalizes local communities. The extent to which immigrants are able to become integral parts of American communities around the country—commonly referred to as immigrant integration—is an important part of maximizing the potential of immigrants for the well-being of all residents.
While Washington remains unable to fix the country’s broken immigration system, local governments have increasingly come to recognize immigrants’ valuable role in their success, and are working to create environments that ensure that all residents are able to fulfill their potential. Despite this exponential increase in local policies that aim to welcome, attract, and integrate immigrants—from offices of immigrant affairs, to language access programs, to support for immigrant entrepreneurs—we have yet to evaluate these policies across cities, and yet to gauge how immigrants fare in these communities. Until now.
New American Economy’s (NAE) Cities Index examines for the first time the landscape of local policy toward immigrants as well as how immigrants are doing in these cities by looking at their economic, social, and political outcomes. This comprehensive framework allows New American Economy to measure and compare immigrant integration across the 100 largest cities in the United States.
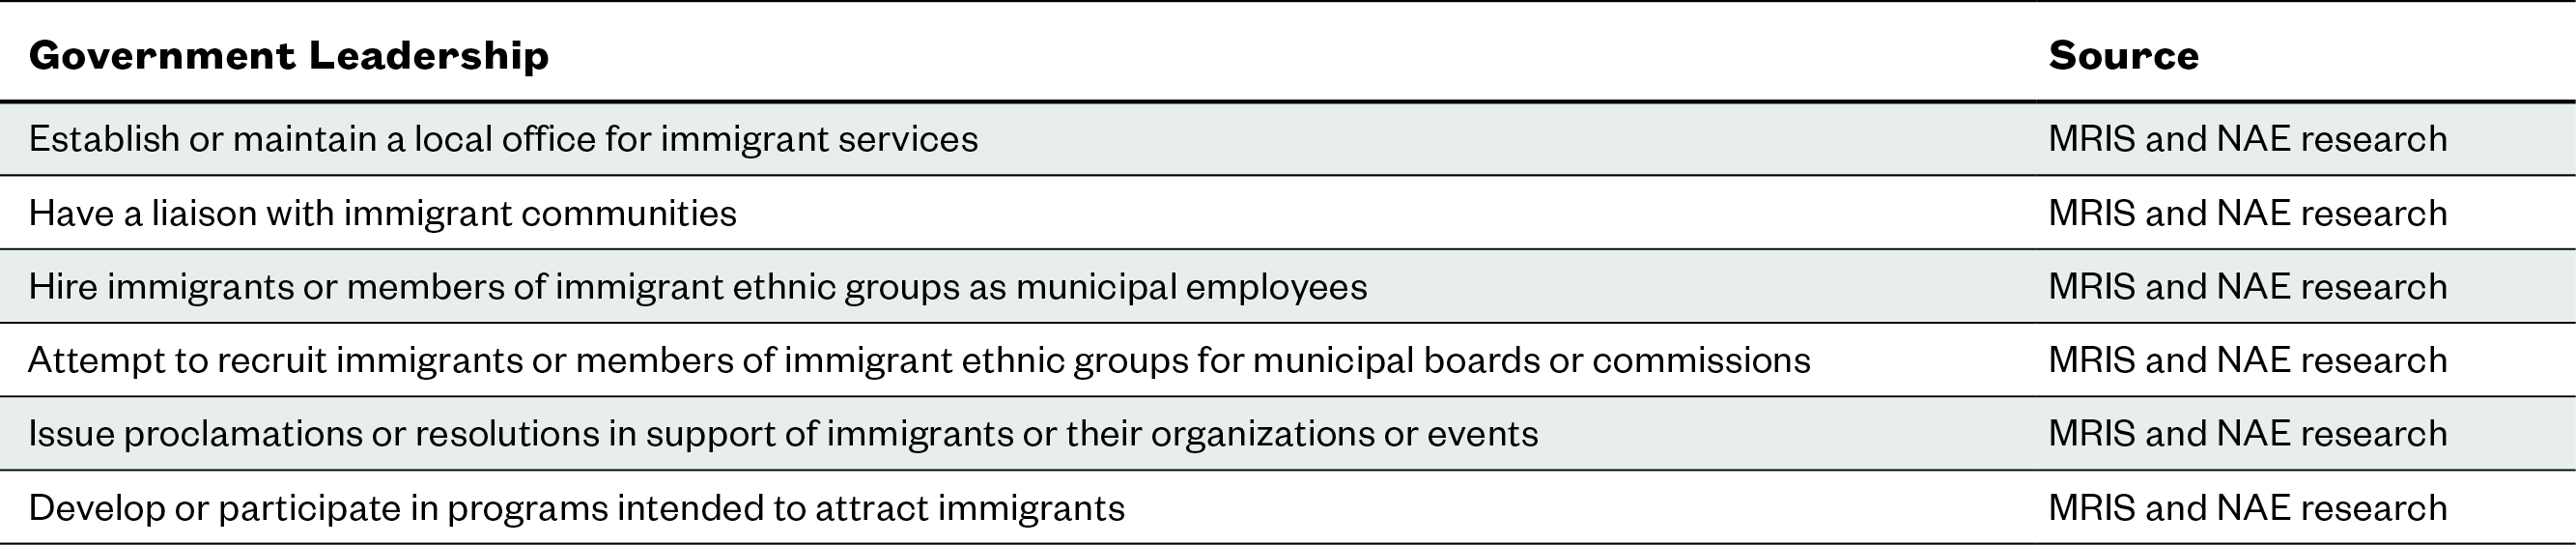
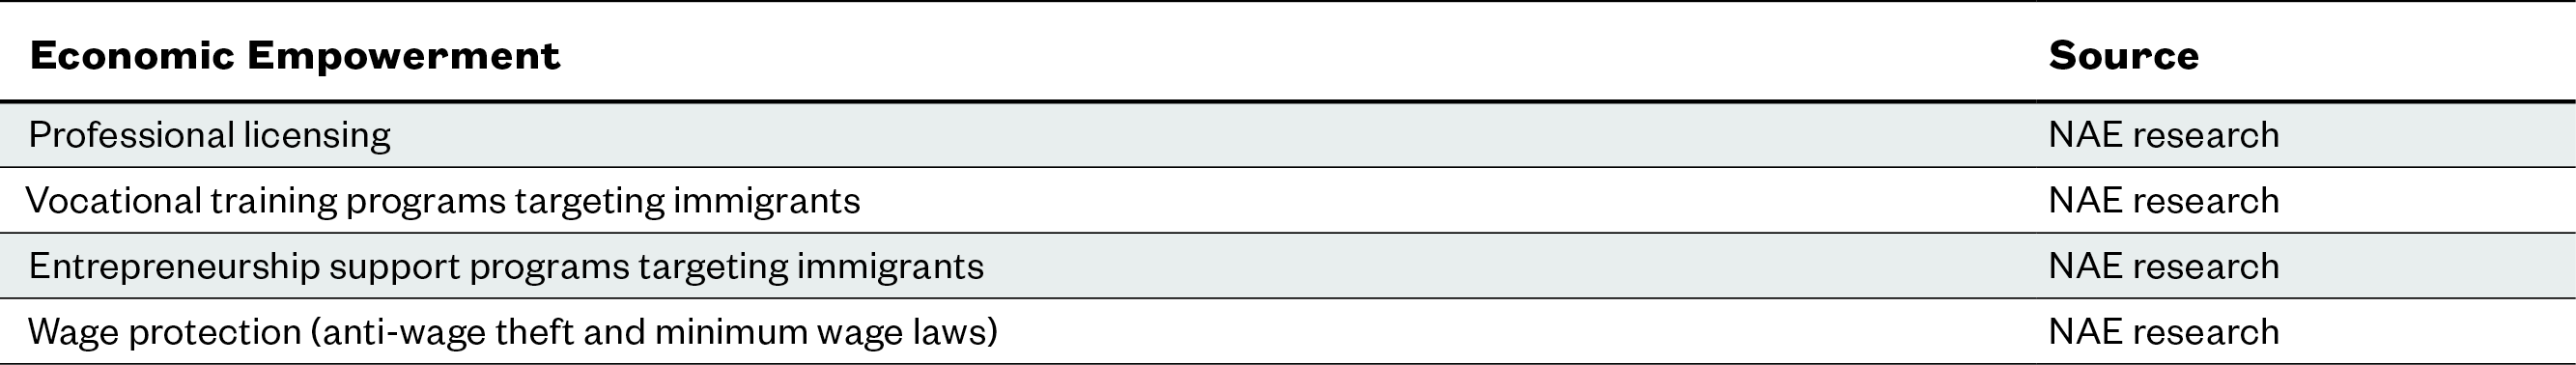
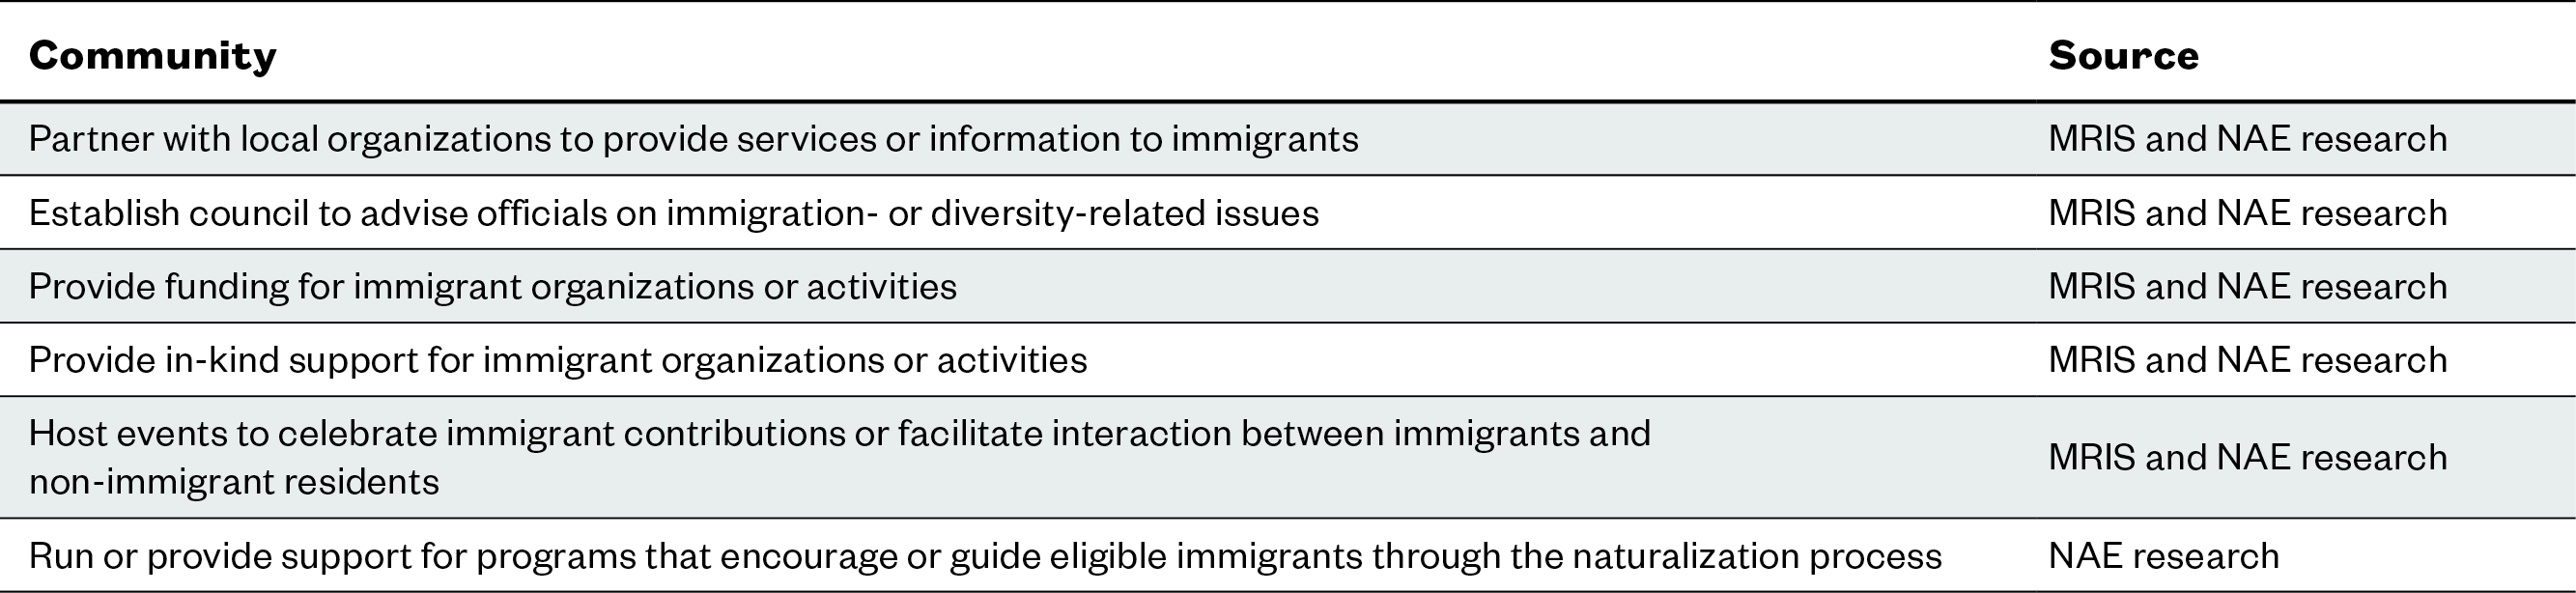
The Index looks at two categories to assess immigrant integration: 1) local policies—and 2) socioeconomic outcomes—and specifically the disparities in those outcomes between immigrants and their U.S.-born counterparts. To evaluate the level of policy support for immigrants in each city, NAE examines policies directed toward or affecting immigrant populations using 38 unique measures across different six subcategories including: government leadership; economic empowerment; inclusivity; community; legal support; and inclusive emergency management. For socioeconomic outcomes, we use 20 indicators that fall into four subcategories: job opportunities; economic prosperity; livability; and civic participation.
To ensure the academic rigor of the Index, an advisory committee of experts on immigration and immigrant integration, including academics and policy experts from non-partisan think tanks, was formed to regularly advise the development of this tool.
As such, the Index fills a critical gap in how we can systematically evaluate immigrant integration at the municipal level through local policies and socioeconomic outcomes. To generate further insight into integration patterns, the Index offers comparison groups ranging from geographical region, to the relative size of the foreign-born population, to the state-level policy environment. NAE hopes this tool will be useful to a wide audience, from city leaders and policymakers looking to understand how they compare to their peers and who seek to benchmark outcomes in their cities, to academics interested in patterns and trends across regions and categories, to journalists who will have access to more nuance and data on immigration at the local level.
With the annual release of the Index, NAE aims to track the level of immigrant integration in American cities over time. In the long run, we hope that the Index will continue to generate more actionable knowledge and support evidence-based decision-making when it comes to immigration policies that ultimately will prove beneficial for hundreds of millions of Americans, both U.S.-born and foreign-born. Learn More about NAE
Advisory Committee
To advise and guide the development of the Cities Index, NAE gathered experts in the field of immigration and immigrant integration. NAE would like to recognize and thank the advisory committee members for their invaluable insights and contributions to this project.
Hamutal Bernstein Urban Institute
Els de Graauw City University of New York
Xi Huang University of Central Florida
Meg Shoemaker Little Welcoming America
Justin Lowry SUNY Plattsburgh
Manuel Pastor University of Southern California
Audrey Singer
Abigail Fisher Williamson Trinity College
James Witte George Mason University
Tom Wong University of California, San Diego
Best Practices
What does success look like for a city? Learn more about best practices in immigrant integration from cities across the country. Download the Best Practices Guide
Methodology
Scope
NAE looks at the 100 largest cities in the United States by total population, using the microdata from the 5-year sample of the American Community Survey (ACS), downloaded from the Integrated Public Use Microdata Series (IPUMS) database.1 The demographic features of these cities include:
- Total population is more than 200,000 people.
- Foreign-born population is more than 10,000 people.
- The share of total population that is foreign-born is more than 3.4 percent.
We define an immigrant as anyone born outside the country to non-U.S. citizen parents who is living here and counted by the census. This includes naturalized citizens, green card holders, temporary visa holders, refugees, asylees, and undocumented immigrants, among others.
The Policy Section
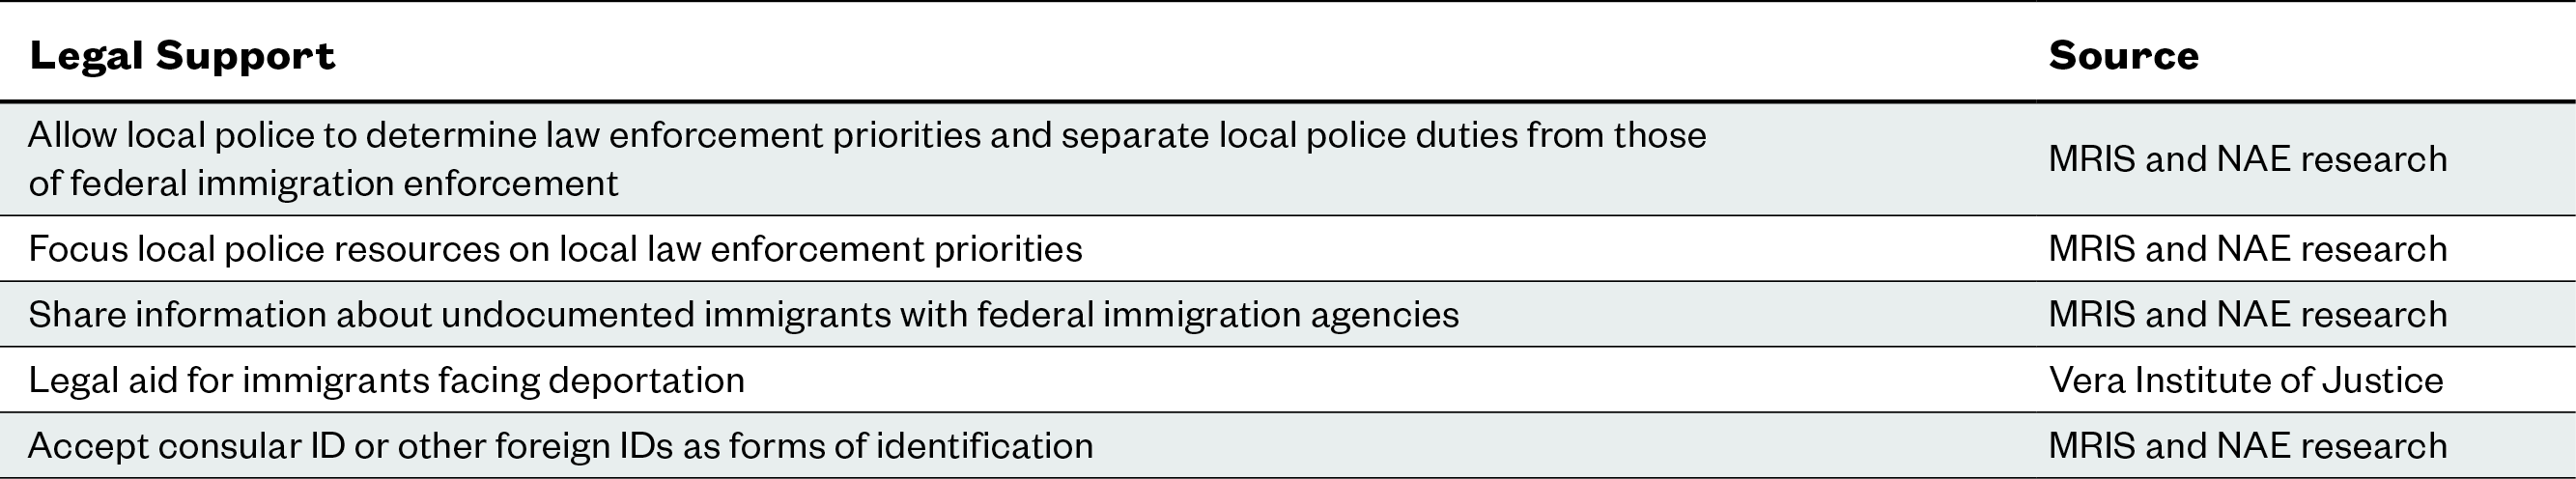
We build on the policy information collected by Abigail Fisher Williamson (Trinity College) in the 2016 Municipal Responses to Immigrants Survey (MRIS) and gather information from additional sources, including Vera Institute of Justice, National Center for Children in Poverty, Urban Institute, and National Immigration Law Center. The information is up-to-date till August 2021. After compiling the information, we assign scores to the policies within the range of 0 to 1. Some policies are assigned a binary value of 0 or 1, while others are assigned a more nuanced value to reflect if the policy coverage is comprehensive, limited or none. These policies are put into six subcategories: government leadership, economic empowerment, inclusivity, community, legal support, and emergency management. The policy indicators in each subcategory are rated on a 0 to 1 scale, based on if a city does or does not have each specific policy. For a more detailed description of the NAE Index scoring methodology, please email [email protected].
In light of the important role cities are playing in the COVID-19 response and recovery effort, we added to the Index a brand new subcategory on inclusive emergency management in 2021, developed through a multi-city research effort funded by the Walmart Foundation. The indicators in this new subcategory include:
- Have emergency management and hazard mitigation plans that are inclusive of immigrant groups during their planning and drafting process
- Provide the information for official emergency responses in languages other than English
- Have multilingual or culturally competent representatives to reach out to immigrant residents during emergencies
- Have programs to help immigrants access medical services during emergencies
- Provide support for immigrant workers and families who may have trouble accessing federal aid during emergencies
- Provide additional targeted relief to immigrant-owned small businesses that may have trouble accessing federal aid during emergencies
- Take actions to remove barriers to broadband access for low-income residents, regardless of their immigration status
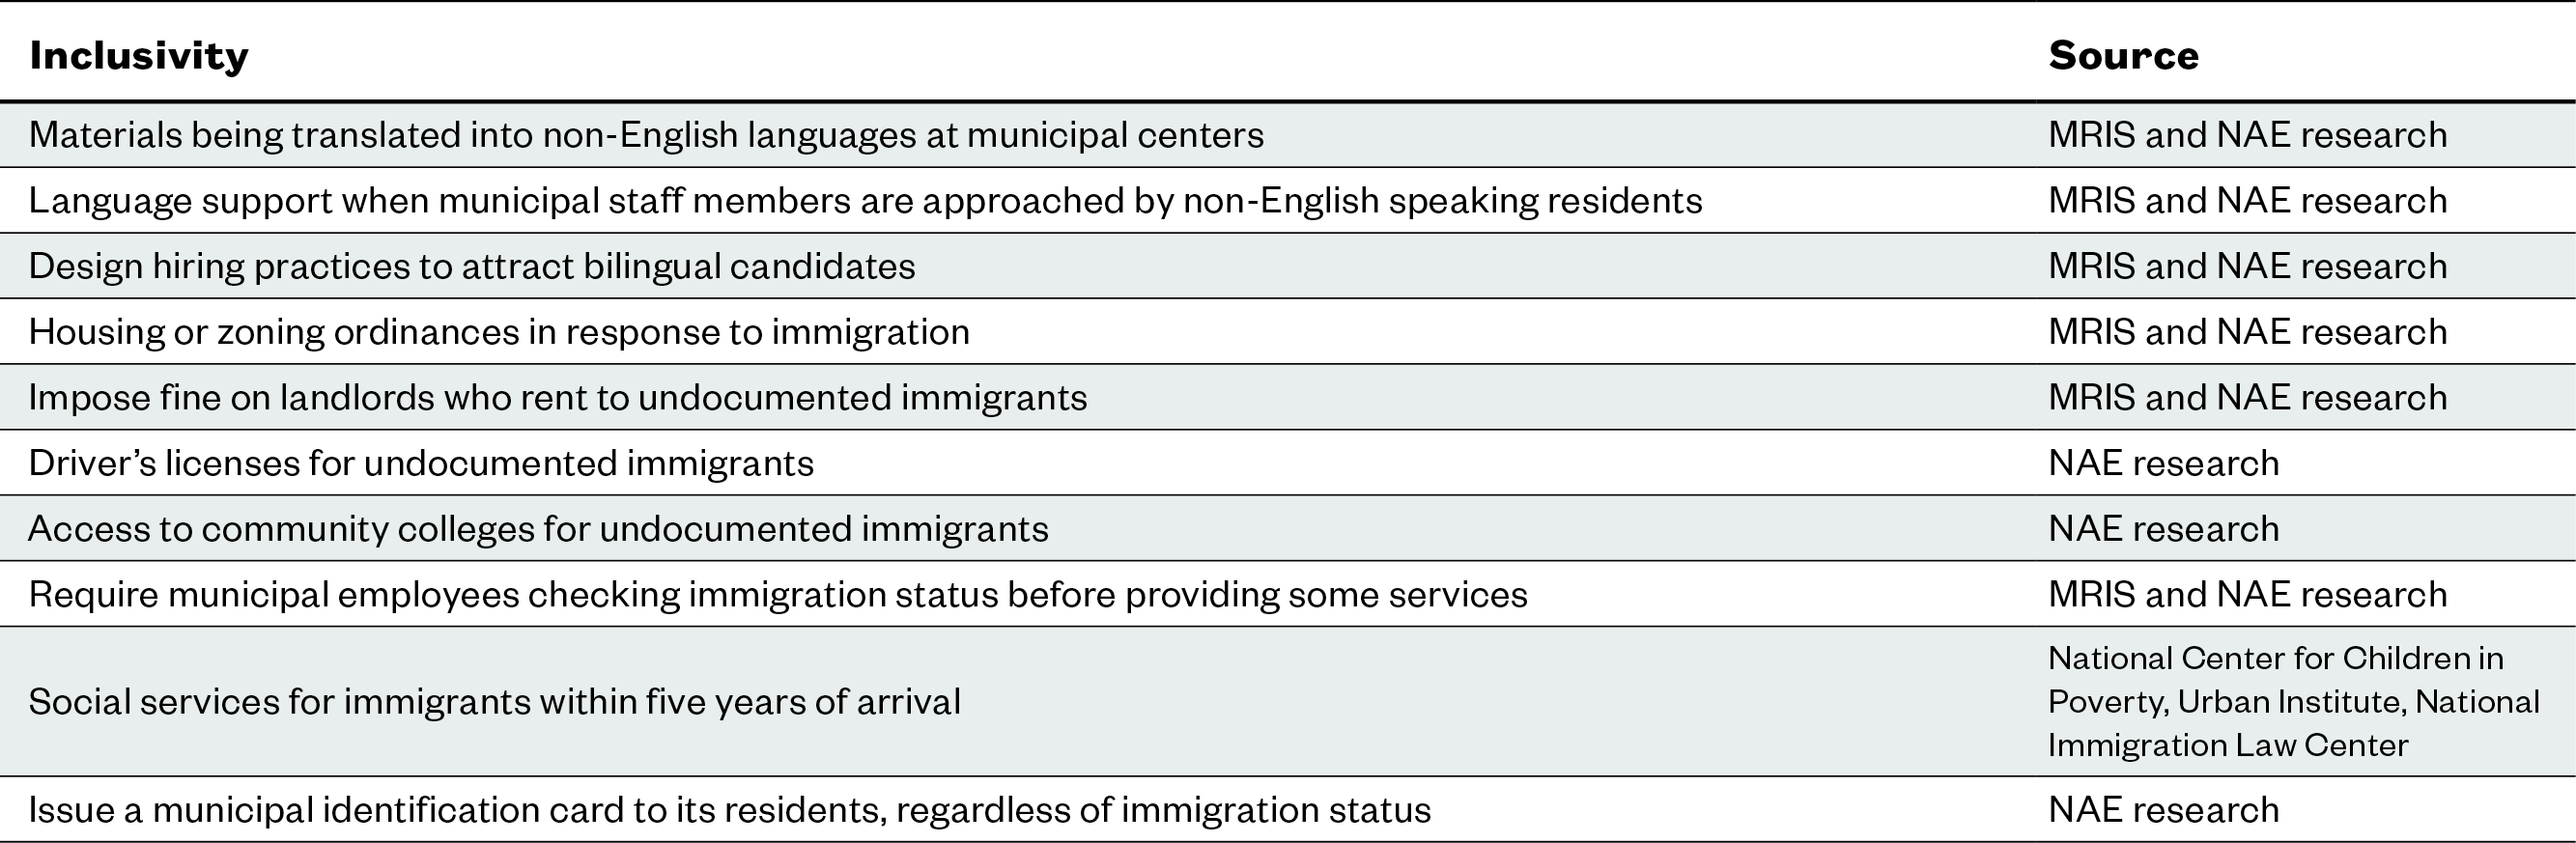
To generate a score for each subcategory in the policy section, we apply the scoring system used in the California Immigrant Integration Scorecard.2 We calculate the average of existing values using equal weights, assuming neutral values for missing responses. Since the policy areas for some indicators overlap, we take the average of these indicators to avoid overweighting these policy areas. We calculate the average of the following three policy scores to generate a score for the policy area of language access:
- Materials being translated into non-English languages at municipal centers
- Language support when municipal staff members are approached by non-English speaking residents
- Design hiring practices to attract bilingual candidates
We calculate the average of the following two policy scores to generate a score for the policy area of housing access:
- Housing or zoning ordinances in response to immigration
- Impose fine on landlords who rent to undocumented immigrants
In order to make fair comparisons across the diverse set of cities in our sample, we normalize the values for each subcategory. We calculate the Z-scores (how many standard deviations a value is from the mean) based on values for all 100 cities and then assign subcategory scores to each city based on their Z-score in each subcategory: 5 means the highest level of policy support for immigrants and 1 means the lowest level of support.
- Score 5: Z-score > 1
- Score 4: 0.5 < Z-score <= 1
- Score 3: -0.5 < Z-score <= 0.5
- Score 2: -1 < Z-score <= -0.5
- Score 1: Z-score <= -1
To generate a score for the policy section, we calculate the average of the scores of each subcategory in the section using equal weights.
The Socioeconomic Section
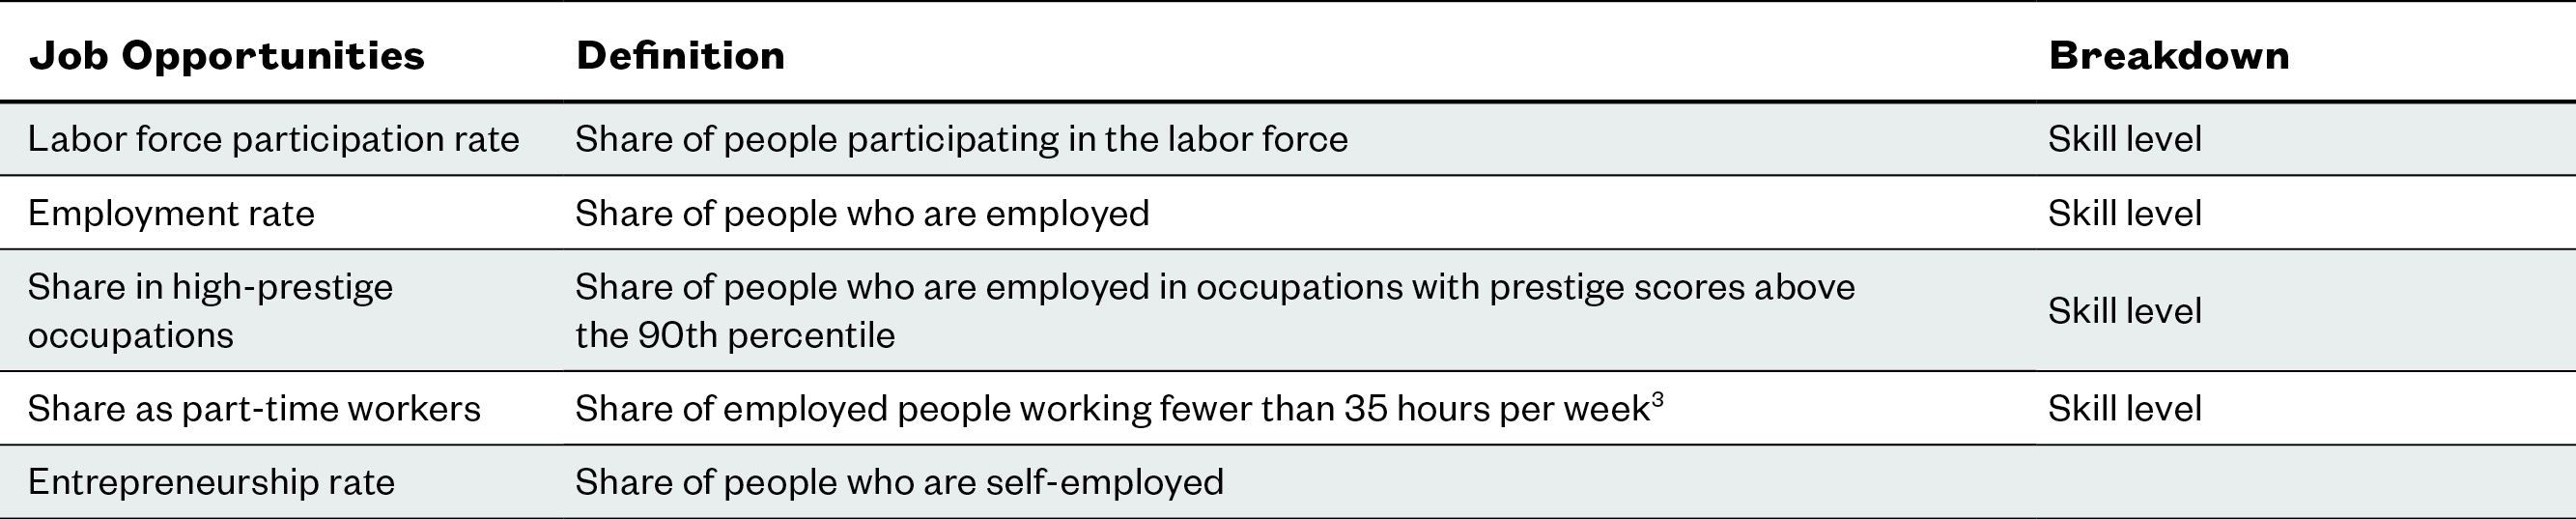
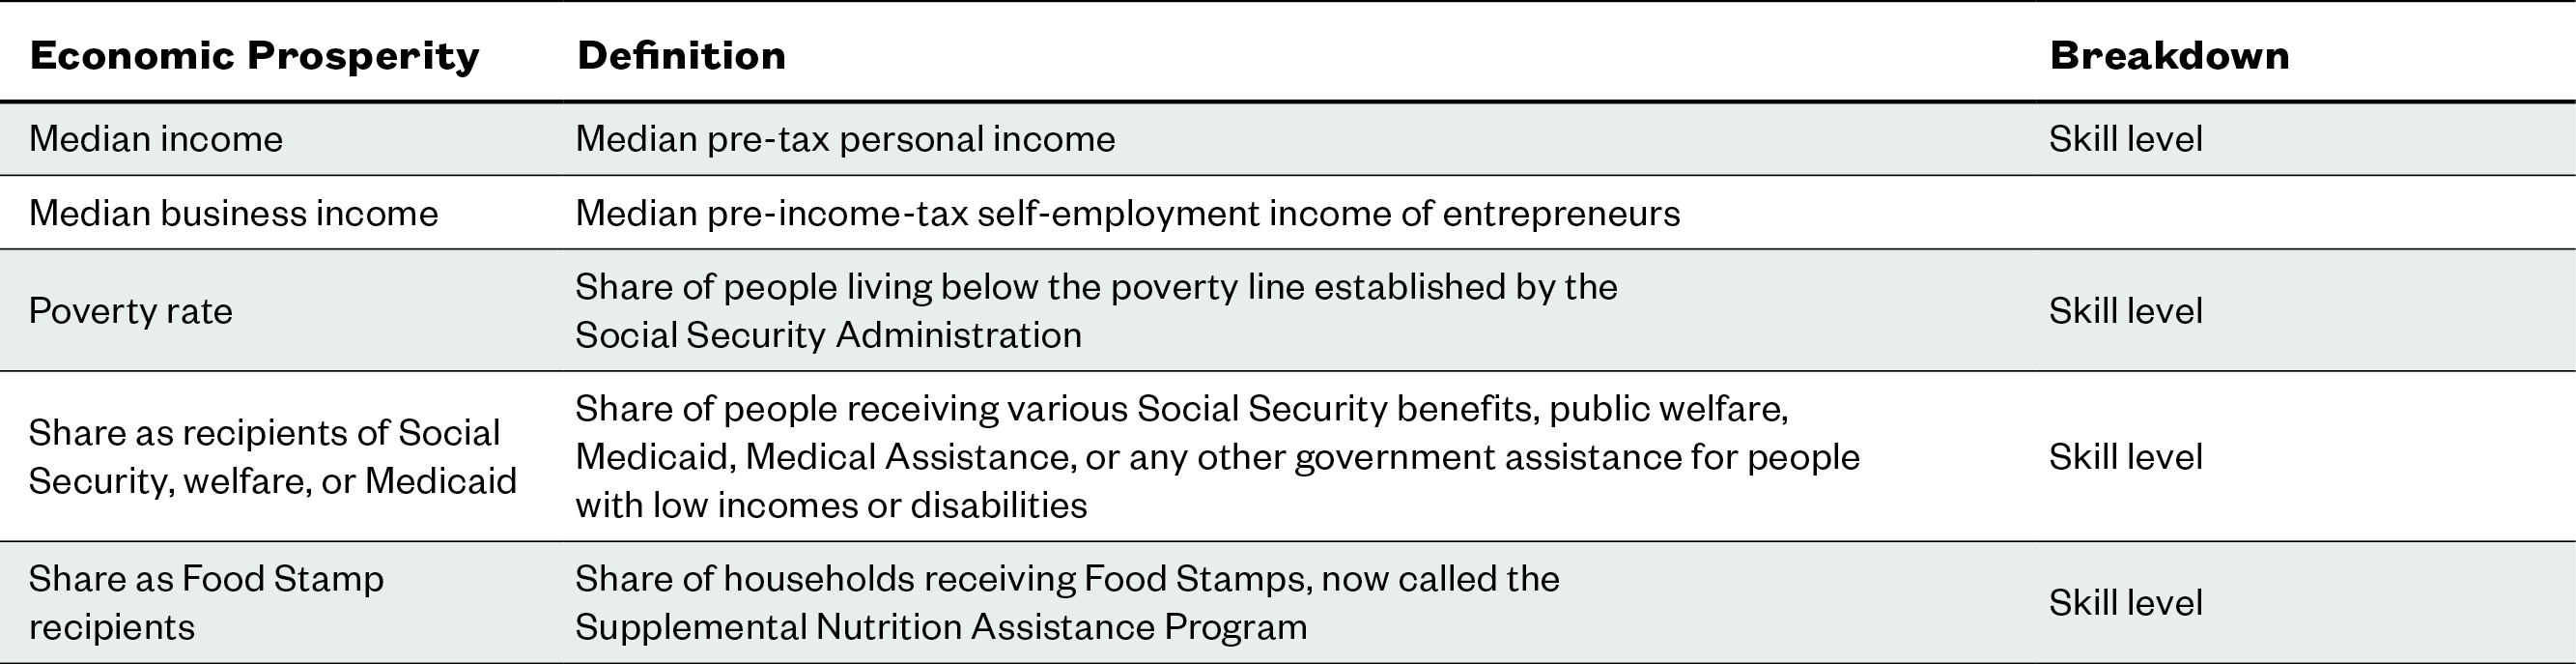
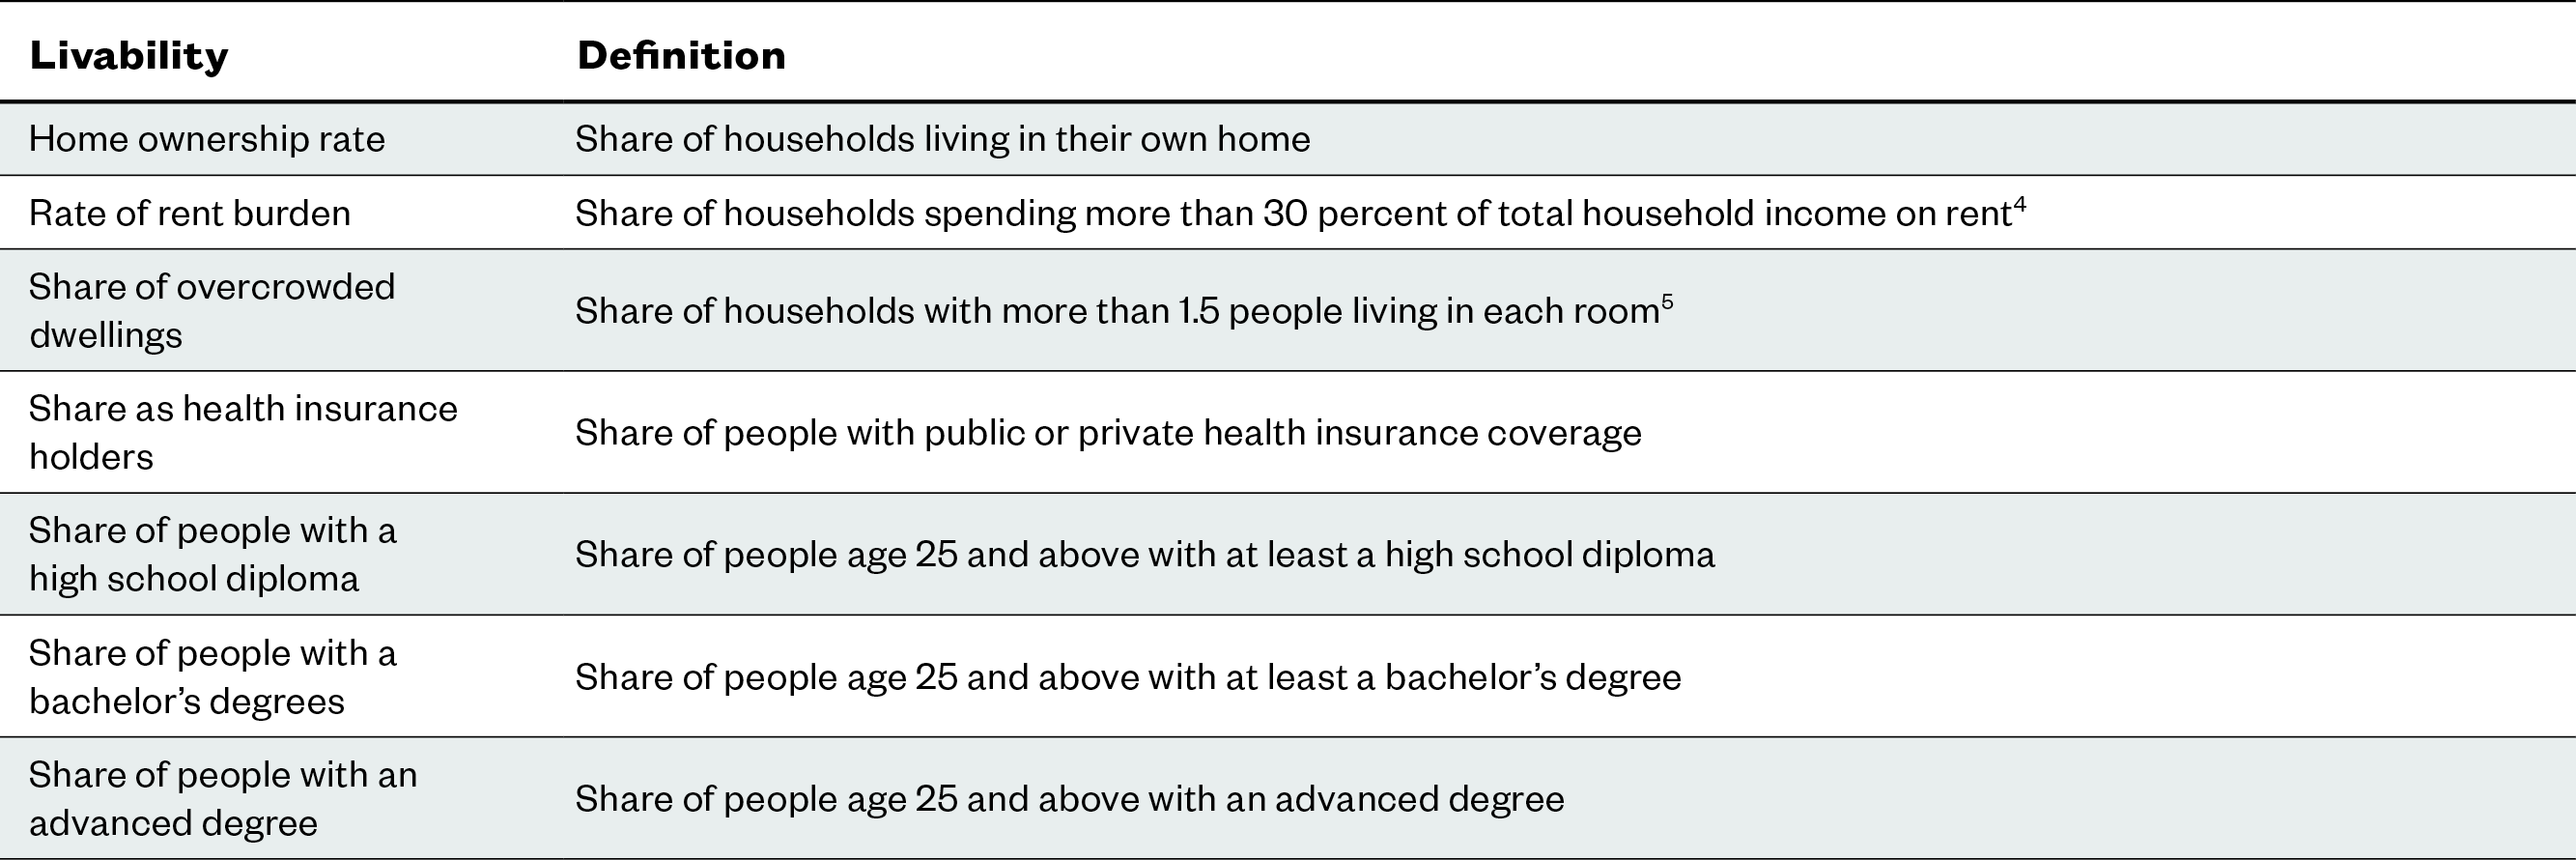
We analyze the microdata of the 5-year sample from the ACS to measure the disparities in socioeconomic outcomes between immigrants and their U.S.-born counterparts in the top 100 U.S. cities. Some indicators are broken down by skill level to make the outcomes more comparable. High-skilled residents refer to people who have a bachelor’s degree or higher, while low-skilled residents refer to people who don’t have a bachelor’s degree. These indicators are put into four subcategories: job opportunities, economic prosperity, livability, and civic participation. See the tables below for more details.
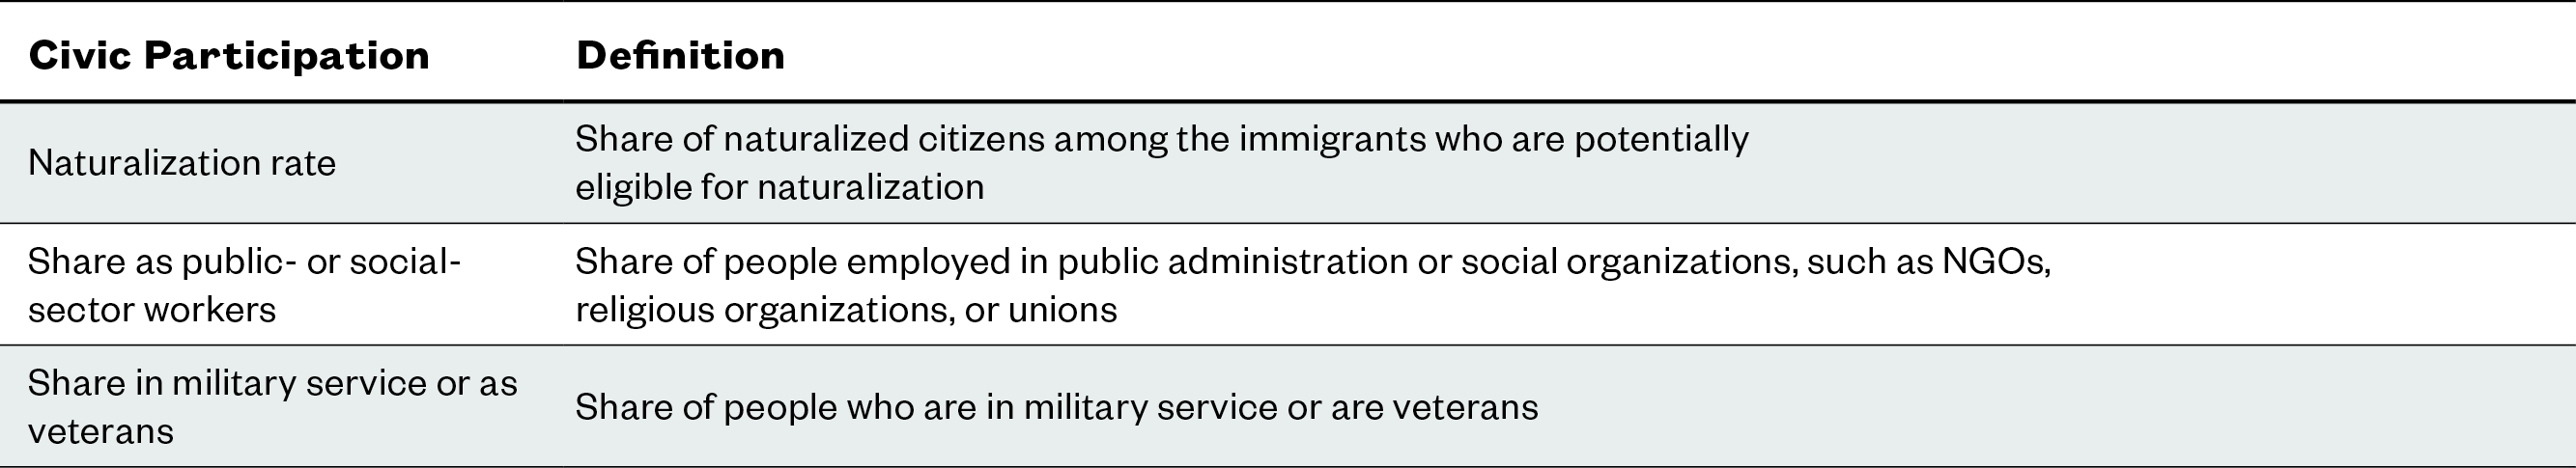 To measure disparities in socioeconomic outcomes, for each indicator, we calculate the ratio of the value for immigrants to that for their U.S.-born counterparts in the same city, e.g. the ratio of employment rate for immigrants to the rate of the U.S.-born in Dallas. For indicators that are broken down by skill level, we calculate the ratio of the value for immigrants to that for their U.S.-born counterparts with the same skill level in the same city, e.g. the ratio of employment rate of high-skilled immigrants to the rate of high-skilled U.S.-born residents in Riverside, California. In addition, we calculate the average of the ratios at the high skill level and the low skill level for each indicator to avoid overweighting an indicator. We also calculate the ratio of the share of immigrants at a certain level of educational attainment to that of their U.S.-born counterparts in the same city, e.g. the ratio of the share of immigrants with a bachelor’s degree to the share of U.S.-born residents with such a degree in New York City. In addition, we calculate the average of the ratios for high school diplomas and above, bachelor’s degrees and above, and advance degrees to reduce the impact of overweighting people with bachelor’s degrees and advanced degrees. For naturalization rate, which doesn’t apply to the U.S.-born population, we take its absolute value as the value for the indicator. To normalize the values for each indicator to make apples-to-apples comparison, we use the same scoring system as the policy section and calculated the Z-scores for each city based on values for all 100 cities.6 For indicators that have positive implications of people’s socioeconomic well-being, such as employment rate, we assign a score to a city based on its Z-score: 5 means the highest level of immigrant integration and 1 means the lowest level of integration.
- Score 5: Z-score > 1
- Score 4: 0.5 < Z-score <= 1
- Score 3: -0.5 < Z-score <= 0.5
- Score 2: -1 < Z-score <= -0.5
- Score 1: Z-score <= -1
For indicators that have negative implications of people’s socioeconomic well-being, we reverse the order of the scoring system. These indicators include:
- Share of part-time workers
- Poverty rate
- Share as recipients of Social Security, welfare, or Medicaid
- Share of households receiving food stamps
- Rate of rent burden
- Share of overcrowded dwellings
For these policies, 5 still means the highest level of integration and 1 means the lowest level of integration.
- Score 5: Z-score <= -1
- Score 4: -1 < Z-score <= -0.5
- Score 3: -0.5 < Z-score <= 0.5
- Score 2: 0.5 < Z-score <= 1
- Score 1: Z-score > 1
To generate a score for each subcategory in the socioeconomic section, we calculate the average of the scores for all indicators in a subcategory using equal weights. To put the scores of the subcategories in the socioeconomic section on the same scale of 1 to 5 as in the policy section, we normalize the scores in each subcategory and re-assign scores to a city based on its Z-score in each subcategory: 5 means the highest level of immigrant integration and 1 means the lowest level of integration.
- Score 5: Z-score > 1
- Score 4: 0.5 < Z-score <= 1
- Score 3: -0.5 < Z-score <= 0.5
- Score 2: -1 < Z-score <= -0.5
- Score 1: Z-score <= -1
To create a score for the socioeconomic section, we calculate the average of the scores of each subcategory in the section using equal weights.
The Overall Score
To generate an overall score for each city, we calculate the average of the scores of the socioeconomic section and the policy section so that each city’s overall score fall between the range of 1 to 5.
Comparison Groups
We develop six ways to group the 100 cities in order to provide more context for city-to-city comparison.
Geographic Region
Based on the geographic regions and divisions set up by the U.S. Census Bureau, we use six geographic regions to group the cities:7 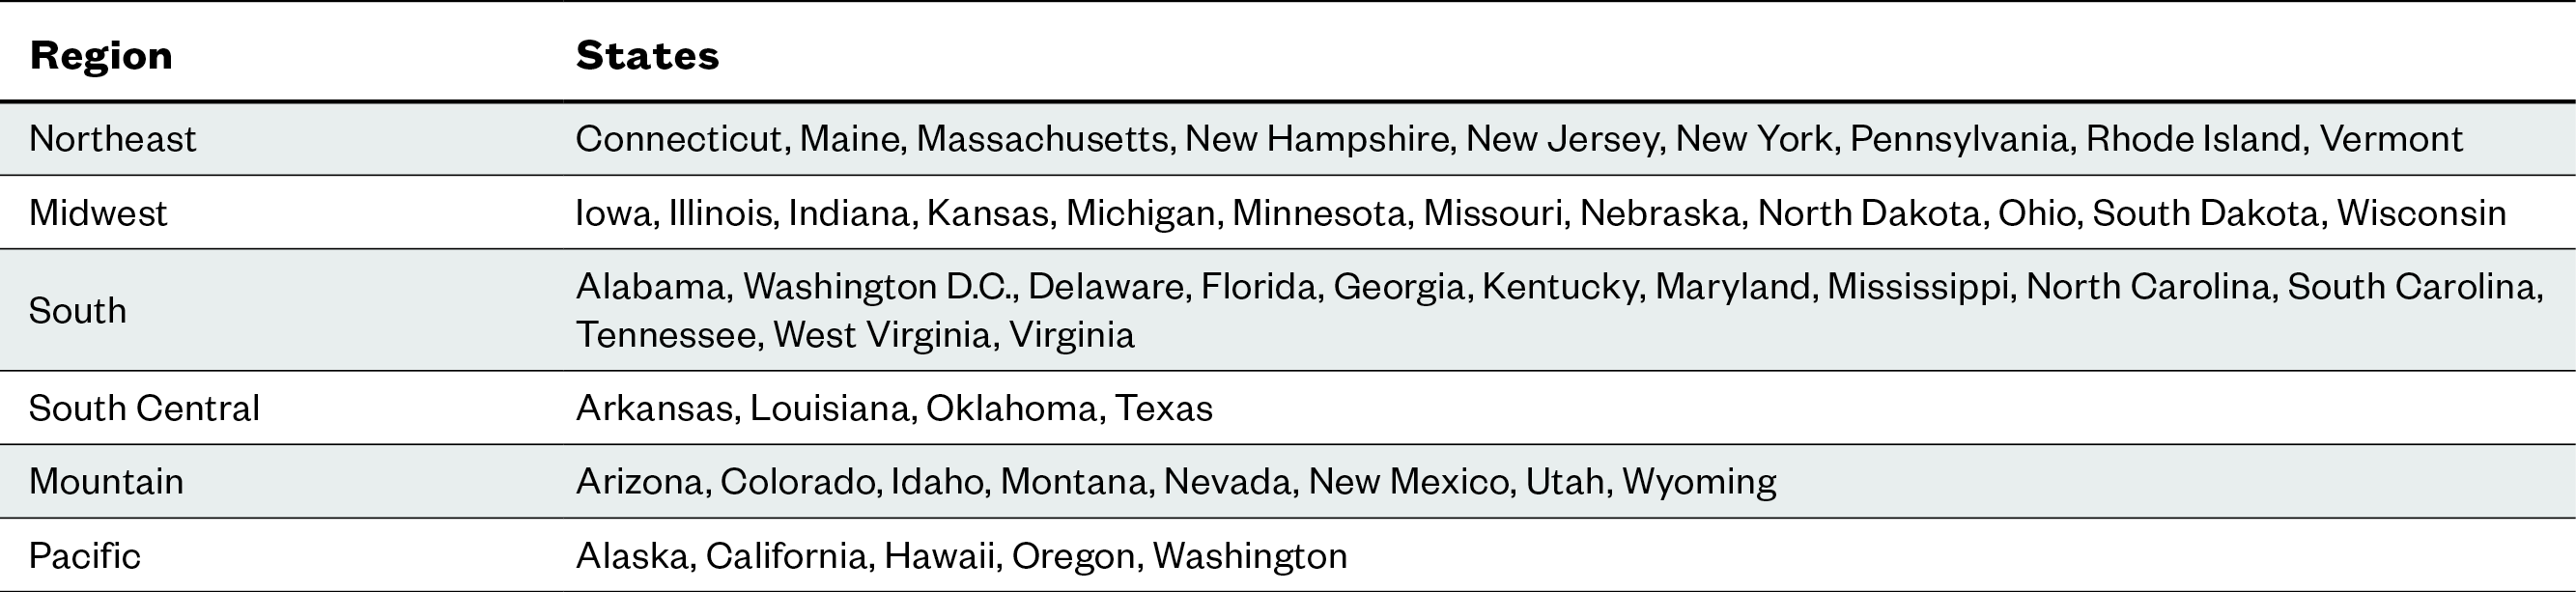
Share of Foreign-Born Population
We group the cities into quintiles based on the share of their total population that was foreign-born in 2019.
Immigration Gateway Type
Using the typology of immigrant gateways from the Brookings report, we group cities based on the types of the metropolitan areas that they fall into.8 In addition, for cities in metro areas that aren’t included in the report, we assign them into different groups by matching their demographic characteristics with the description of different gateway types.
State-Level Political Environment
Using the partisan composition tool developed by the National Conference of State Legislatures, we group cities based on the types of state control in 2021, which has taken into consideration both legislative control and party affiliation of governors.9
State-Level Policy Environment
Based on policy information from the MRIS and our research, we compile additional scores for immigration policies at the state level, using the same scoring system for the policy section. We then group cities into quintiles based on their state-level policy scores. State-level policies include:
- Professional licensing for immigrants
- Social services for immigrants within five years
- Access to community colleges for undocumented immigrants
- Driver’s license for undocumented immigrants
Size of City Budget
Using data of spending per resident from Ballotpedia from the fiscal years of 2014 and 2015, we group the cities into quintiles based on the size of their city budget per resident.10
Notes
1 Steven Ruggles, Katie Genadek, Ronald Goeken, Josiah Grover, and Matthew Sobek. Integrated Public Use Microdata Series: Version 7.0[dataset]. Minneapolis: University of Minnesota, 2017. 2 Manuel Pastor, Rhonda Ortiz, Vanessa Carter, Justin Scoggins, and Anthony Perez. “California Immigrant Integration Scorecard.” Center for the Study of Immigrant Integration. 2012. Available online. 3 “What Constitutes a Full-Time Employee Under H-1B Visa Program?” U.S. Department of Labor. Available online. 4 “Affordable Housing.” U.S. Department of Housing and Urban Development. Available online. 5 “Measure Overcrowding in Housing.” U.S. Department of Housing and Urban Development. 2007. Available online. 6 Manuel Pastor, Rhonda Ortiz, Vanessa Carter, Justin Scoggins, and Anthony Perez. “California Immigrant Integration Scorecard.” Center for the Study of Immigrant Integration. 2012. Available online. 7 “Census Regions and Divisions of the United States.” U.S. Census Bureau. 2010. Available online. 8 Audrey Singer. “Metropolitan Immigrant Gateways Revisited, 2014.” Brookings Institution. 2015. Available online. 9 “State Partisan Composition.” National Conference of State Legislatures. 2018. Available online. 10 “Analysis of Spending in America’s Largest Cities.” Ballotpedia. Available online.
Download the complete NAE Cities Index data
Looking for even more information about your city? Enter your information below and we'll email you our comprehensive data file with all of the publicly available metrics we evaluated for the NAE Cities Index.
Thank you. Please check your email for information about downloading the data file.
You will receive occasional emails from NAE. You can unsubscribe at any time.
About NAE
New American Economy is a bipartisan research and advocacy organization fighting for smart federal, state, and local immigration policies that help grow our economy and create jobs for all Americans. More…
The Latest
March 2, 2022
New Report Shows Immigrants in Southwest Kansas Paid Over $192 Million in Taxes and Held More than $595 Million in Spending Power in 2019
February 3, 2022
New Report Shows Immigrants in Passaic County Paid Over $1.3 Billion in Taxes and Held $3.6 Billion in Spending Power in 2019
How does NAE define an immigrant?