Between now and 2020, as many as
25.6 million Hispanic and Asian voters
could join the U.S. electorate.


How will these voters impact election results? That depends on how many of these
individuals come out to vote-and how successful each party is at earning their support.
Build a scenario to
see how these
new voters impact
presidential elections.
- Select election year
- Select voter turnout
- Select percent of Hispanics and Asians supporting the GOP

Percent
margin of
victory
for Dems
or GOP
Changes to
2020
Arizona
Asian & Hispanic Population
Will turn 18
Will naturalize
Unregistered voters
Simulated
2020
Election Result
Net new voters
Obama 2012 win/loss margin
Estimated
Margin
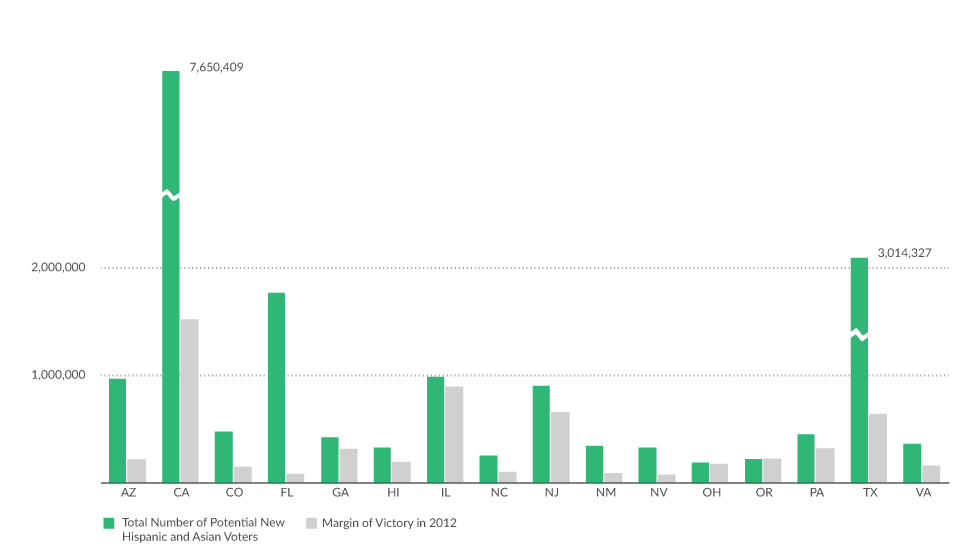
Explore total number of new voters
In 16 states, there could be more new Hispanic and Asian voters by 2020 than decided the 2012 presidential result in the state.