
Interactive Map Projects Potential Impact of Hispanic and Asian Voters in 2016 Elections
Date: June 24, 2015
By 2016, 19.2 Million New Hispanic and Asian Voters Could Join the U.S. Electorate and Impact Election Results in Key States. By 2020, that Number Could Reach 25.6 Million.
New York, NY —As 2016 candidates jockey for the minority vote, the New American Economy released an interactive map that allows users to adjust Hispanic and Asian voter turnout and party support in each state to explore how new Hispanic and Asian voters could impact the 2016 and 2020 presidential elections. The map uses expanded data from a research brief produced by the Partnership, “The Changing Face of the Nation: How Hispanic and Asian Voters Could Reshape the Electorate in Key States,” that shows how an increasing number of Hispanic and Asian voters could shift the electorate in 18 key states across the country by 2020.
View the interactive map here.
“With a potential 19.2 million new Hispanic and Asian voters in the 2016 election, candidates cannot afford to ignore this increasingly important part of the electorate,” said John Feinblatt, Chairman of New American Economy. “This map shows that the voting pool is changing, especially in key states, and candidates who understand this have a real path to the White House in 2016 and beyond.”
By 2020, the U.S. electorate could gain 25.6 million potential new voters, including millions in key states, between Hispanic and Asian voters who:
- Are eligible to vote, but are unregistered
- Will turn 18 and become eligible to vote
- Are immigrants who will naturalize and become eligible to vote
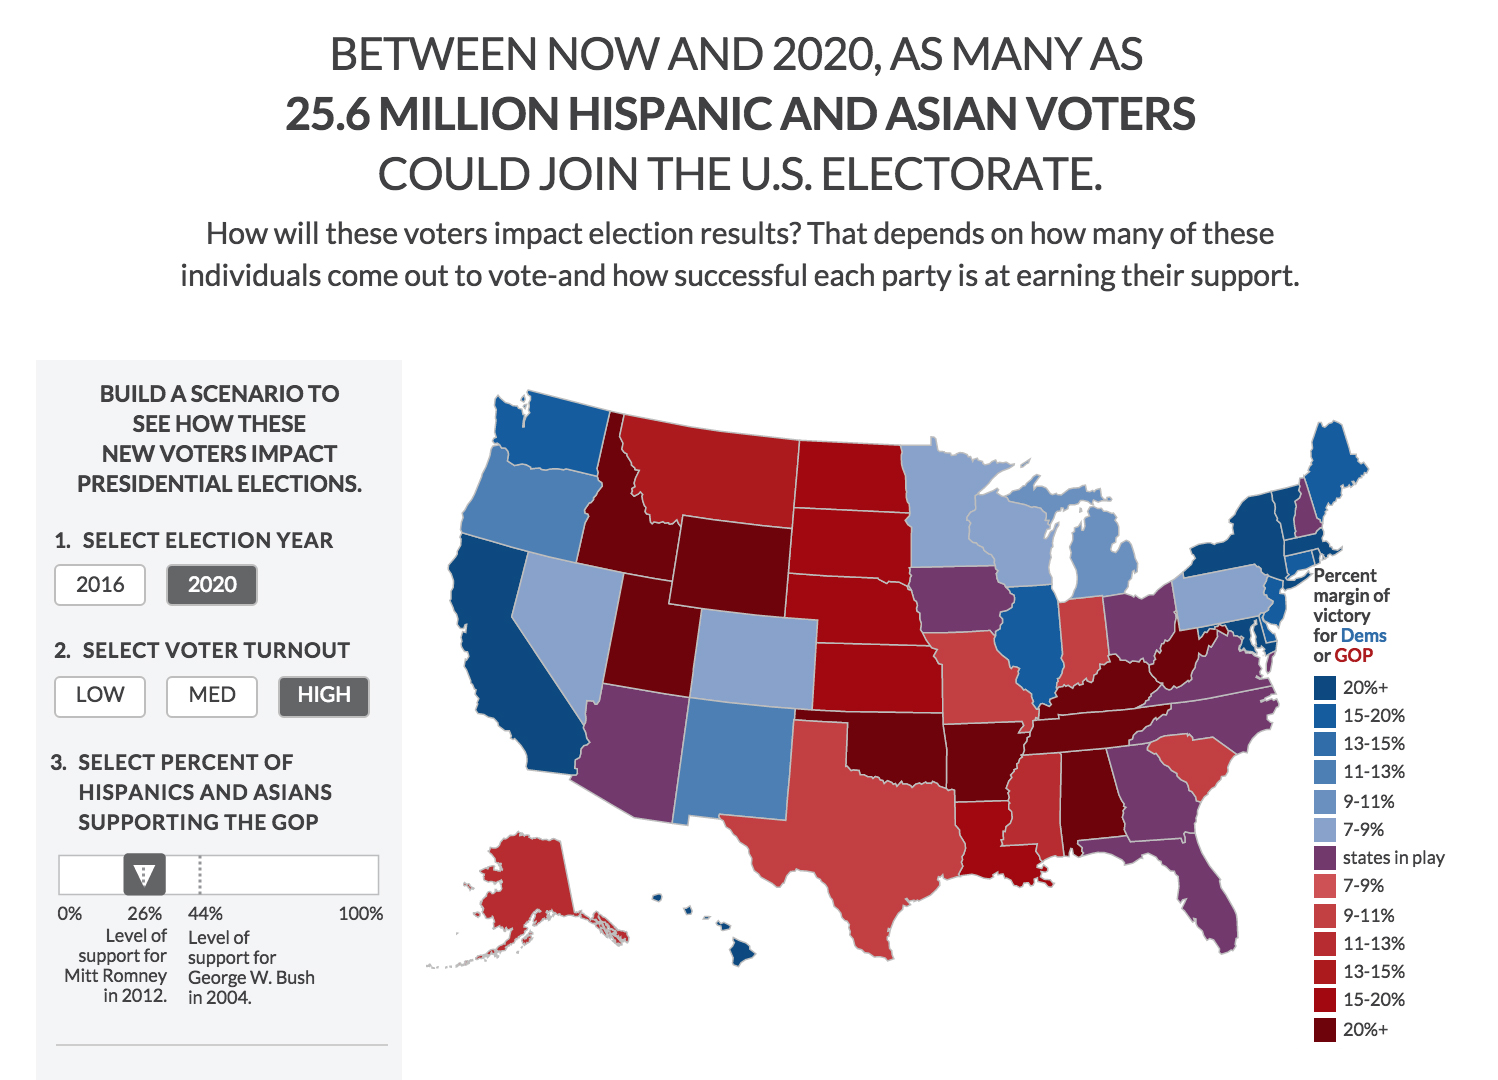
Users of the voting interactive can build scenarios by:
- Selecting the election year: 2016 or 2020.
- Projecting levels of Hispanic and Asian voter turnout. The “LOW” scenario projects that Hispanic and Asian voters will turn out at the same levels as they did in 2012. The “HIGH” scenario projects that Hispanic and Asian voters will turn out at the same levels as white voters.
- Designating how much support the GOP will earn from Hispanic and Asian voters. A slider denotes the 2012 level of support for Mitt Romney (26 percent) and the 2004 level of support for George W. Bush (44 percent). The model assigns varying levels of support to individual states based on how much more or less Hispanic and Asian voters supported Republicans than the national average in 2012.
- Comparing state-by-state projections to the results of the 2012 presidential election. States are color-coded on a scale comparing the percent margin of victory for Democratic and Republican parties to potential election outcomes in different scenarios.
CONTACT
Sarah Doolin
New American Economy
[email protected]